EEG Screen Example: Before and After Migraine
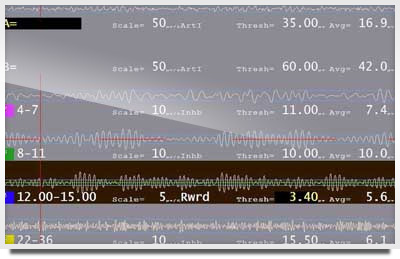
Below are two EEG screens. While you are training, watching the EEG and its behavior can help give you clues whether the client is learning or responding to the training. Change from the existing pattern is usually an indicator that real training is occurring. In the case below, there were changes in the EEG. They were somewhat subtle. As they changed, the person’s migraine subsided.
The learning doesn’t tell you whether you are training the right frequency, the right site, etc. There are multiple factors that determine what to train, and even multiple approaches. The factors include clinical experience and judgment, client profiles based on intake, and potentially much more. But if you’re doing the right training for someone’s brain, it can help tell you if the brain is learning from it.
Some very good therapists pay relatively little attention to the EEG itself and get good results. As most clinicians gain experience, they do utilize information from the EEG behavior to provide clues about the client’s state or response to training. That being said, the really good clinicians – even before they understand the EEG, tune in to the client and their response to the training rather than watching the EEG. There are differences in style and in approach regarding this issue. In a very good EEG display, even therapists who don’t “understand” the EEG are often able to sense the changes occurring but may not be able to describe them.
This EEG was taken during the height of the migraine. Each EEG trace is occurring at the same time below. Each trace shows you a different frequency band of the same EEG.
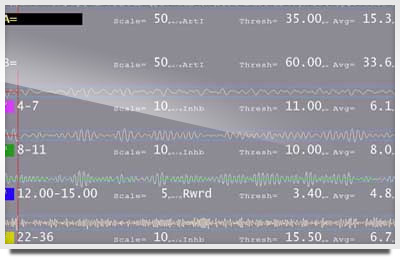
 Note in particular the top band (called the raw EEG) and the band labeled 8-11 Hz — the Alpha band. Compare them to Example 2. These were taken about 10-15 minutes apart. What you’ll notice is that the top band (labeled A) has more larger bursts or waves in example 1 than example 2.
You’ll also notice if you look at the 8-11 Hz band, the EEG is smaller and more “settled” in Example 2 versus example 1. In example the amplitude of 8-11 hz is 10 microvolts (avg=10). In Example 2, avg= 8 microvolts. This turned out to be a significant change and correlated directly with the reduction of migraine.
Note these are snapshots of the EEG, which is changing constantly. Each represented the pattern shift that was seen during the training.

EEG screen once the migraine had subsided.

